sci.geo.oceanography
Oceanography and marine science.
Physical and biological oceanography discussed by researchers, students and sea-adjacent amateurs — El Niño threads, instrument talk, cruise reports.
Kept as a directory entry for the sci.geo branch the gateway carried.
On this page
- Two proposers and a request for discussion
- The charter, as voted
- The ballot
- What 620 addresses show
- A science whose instrument is a ship
- Ship time, and the committee that allocates it
- The institutions that own the ships
- Bottles, thermometers and the shape of a station
- The CTD, and the section
- The expendable probe, and the correction that reached backwards
- Instruments left behind
- The view from orbit
- The programmes the decade was made of
- A deep sea that had recently surprised everybody
- Archives, and a discipline required to deposit
- What the archives were for
- What the group carried, as classes of traffic
- The arguments of the decade
- Where it went
- What the record does not show
- Scope and limits of this page
Two proposers and a request for discussion
The group began, as Big-Eight groups did, with a document. On 2 June 1994 Charles Radley, of the Tranquest Corporation in Cleveland, Ohio, posted a Request for Discussion for an unmoderated group to be called sci.geo.oceanography, and named two proposers: himself and Lachlan Cranswick, at CSIRO in Australia. Both addresses appear again on the ballot paper and again in the result, which is more consistency than some proposals managed. The machinery they were working through — requests for discussion, calls for votes, control messages and the master files that record them — is described on comp.* and is not re-explained here.
The RFD was cross-posted to ten groups, and the list is a serviceable map of which rooms an oceanographer was thought to be sitting in during 1994: news.announce.newgroups and news.groups for the process itself, and then sci.aquaria, sci.bio.ecology, sci.environment, sci.geo.geology, sci.geo.hydrology, sci.geo.meteorology, sci.geo.fluids and sci.physics.computational.fluid-dynamics. Four of them were the sci.geo.* groups then in existence: geology and meteorology, both voted through in 1991, sci.geo.fluids, and sci.geo.hydrology, whose own vote had been declared only that April. The presence of the fish-tank group and the computational fluid dynamics group at the same table is a fair picture of a discipline that recruits from biology, chemistry, geology and applied mathematics.
The purpose was stated in two sentences that are worth quoting because they are the whole argument for a scientific newsgroup, written by people whose alternative was a printing press:
The purpose of sci.geo.oceanography is to provide an open discussion forum for the oceanography community on the internet. The newsgroups allow the rapid and timely discussion of opinions and information that would take months or years (or not at all) on conventional paper journals.
The parenthesis is the interesting part. A cruise report, a calibration problem or a negative result frequently did not reach print at all, and the proposers were offering a place for the material the journals never took. The same document contains a small, dated appeal that belongs to a moment when a research community was only half online: a bracketed request that readers mention the proposal to colleagues who might benefit from an oceanography group but did not normally use newsgroups. It also records that the idea had been aired first in sci.geo.geology, that the interest shown there in follow-ups and private e-mail was what justified proceeding, and that while a preliminary version had been circulated to mailing lists, the RFD itself was not. Even at the outset, the newsgroup and the mailing list were two distinct constituencies that had to be canvassed separately.
One detail dates the paperwork as precisely as a postmark. The RFD sets out the passing rule not in prose but as a Boolean expression — Y greater than N plus 100, and Y greater than two thirds of Y plus N — written in the operator syntax of Fortran. The people organising the vote were scientists who wrote code, and it shows.
The charter, as voted
The charter was not a manifesto but a list, reproduced unchanged in the call for votes, in the result and in the newgroup control message. It ran, verbatim and in its own capitalisation:
physical/chemical/biological/geological oceanography; ocean ecosystems; ocean dynamics; ocean / atmosphere interactions; ocean floor mining / drilling; inland lakes and waterways; ocean instruments; research topics; interesting findings, news; legal, policy issues; Software; Data formats; Databases; Hardware/Equipment - specs, opinions, etc.; Applications; Announcements/reviews of papers/conferences.; General Discussion/opinions/questions.; Positions vacant
Then: Anything else that is relevant to oceanography in general. Read as a description of a working life rather than of a subject, the list is unusually honest. Instruments, hardware, software, data formats and databases occupy five of the eighteen lines — more room than ecosystems, dynamics and air-sea interaction put together. Conferences and papers get a line; so do jobs. This is a charter written by people who knew that most of what one professional says to another is about apparatus, file formats and who is going to sea in the spring.
Two further clauses are characteristic. Advertising was to be tolerated where it was of bona fide interest to oceanographers, and normally only in reply to a request — a rule for a field that buys expensive instruments from a small number of manufacturers and needs to talk to them. And the proposers conceded, in the call for votes, that the name had been disputed: several people had expressed reservations about the precise name and the chosen hierarchy during the discussion, no consensus had formed on anything better, and the vote would therefore go ahead on the name as proposed, with the offer that a better name or hierarchy could be discussed after creation. No such discussion appears anywhere in the archive. The name stood.
The line that mattered most operationally was the one destined for every news server's newsgroups file. As printed on the ballot it read:
sci.geo.oceanography Oceanography, oceanology and marine science
As issued in the creation message six days after the result, and as the Internet Systems Consortium's master file still carries it today, the same line ends in a full stop. Someone added the punctuation between the ballot and the newgroup; nothing in the record says who or why, which is exactly the sort of silent editorial act the sci.geo.* paperwork throws up more than once.
The ballot
The vote was run by a neutral third party, as the rules required. L. Todd Masco, posting for the Usenet Volunteer Votetakers, issued the first of two calls for votes on 24 July 1994, with ballots to be mailed to a single address and all votes to be received by 15 August. A second call went out on 12 August. Voting closed at 23:59:59 GMT on 15 August 1994, and the result was posted on 18 August under a subject line that did the arithmetic for the reader: RESULT: sci.geo.oceanography passes 620:9.
The full accounting was 632 valid votes: 620 in favour, 9 against, and 3 abstentions, with a further 10 ballots rejected. The reason given for every rejection is the same laconic note — no votes — meaning the message reached the counting program without containing any of the four exact statements it was able to parse. Among those ten are two addresses at the CSIRO marine laboratories, which is a small reminder that in 1994 the hardest part of an electronic ballot was persuading busy people to type a sentence exactly as printed.
The margin cleared both thresholds comfortably: a hundred more yes votes than no votes, and a two-thirds majority. Against the rest of its branch it was a large vote — second in the branch only to sci.geo.petroleum's 1,284 to 18 twelve days later, and, at sixty-nine yes votes for every no, one of the most one-sided. The other tallies are set out on sci.geo and are not repeated here.
After the mandatory five-day correction period, David C Lawrence sent the newgroup control message from UUNET on 24 August 1994. It was reissued on 31 August, again on 24 September and once more on 10 May 1995 — routine re-broadcasts of the kind that kept a young group present in the active files of servers which had missed or discarded the first message.
The control archive holds one more item, from much later and of a quite different character: a message of 4 November 2001 asking sites to remove the group, its body the single sentence please remove the bogus newsgroup sci.geo.oceanography, its Newsgroups header naming three groups — sci.config, sci.control, sci.groups — that have never existed. It was one of a sweep of forged removals that passed through the control archive that night and hit every group in the branch; that episode is described on sci.geo and is not retold here. Nothing came of it. The name is still in the ISC master file today, still paired with its 1994 one-line description and still flagged for posting.
What 620 addresses show
Because the votetaker published the full list of voters, this group has one quantitative record almost nothing else about it can supply: an address book of the people who cared enough about an oceanography newsgroup, in August 1994, to send an e-mail about it. The list is of voters, not of readers or of posters, and an electronic-mail domain is a rough proxy for an employer; with those caveats stated, it is still the only census the group ever had. The 620 yes votes come from 414 distinct domains.
By top-level domain, 261 of the yes votes were cast from .edu addresses, 55 from Australia, 53 from Canada, 41 from .com, 40 from the United Kingdom, 35 from .gov and 10 from .mil, with 13 from Japan, 12 from Germany and single-figure counts from South Africa, New Zealand, Italy, Norway, France, Sweden, the Netherlands, Ireland, Poland, Denmark, Brazil and a dozen more. Half the discipline was American and academic; the other half was scattered across every country with a coastline and a research budget.
The institutional clusters are the recognisable ones. Twenty-three yes votes came from the University of California, San Diego, whose oceanography is Scripps; twenty-three from Columbia University's Lamont observatory; twenty-two from the University of Washington; twenty-one from CSIRO in Australia, fifteen of them from the marine laboratories alone; nine from NASA centres, eight from United States Navy addresses, seven from Woods Hole. The distribution is what one would expect of a field organised around a small number of places that own ships.
One pair of British addresses catches the moment particularly well. Twelve yes votes came from a Natural Environment Research Council domain at Southampton and four from another at Wormley in Surrey, then the home of the council's Institute of Oceanographic Sciences. Two years later the Wormley institute, the council's Research Vessel Services from Barry Docks in South Wales and the University of Southampton's departments of oceanography and geology were brought together in a single new waterfront building, opened in 1996 as the Southampton Oceanography Centre and renamed the National Oceanography Centre, Southampton in 2005. In August 1994 that consolidation was still to come; on the ballot paper the two council sites are voting separately.
A science whose instrument is a ship
The reason this group is not simply another sci.* discussion group is contained in a sentence its charter never had to write: an observation of the deep ocean requires a ship, or something a ship has left behind. Physics can be done at a bench, astronomy at a telescope that is bolted to a mountain and stays there, and both of those instruments can be revisited on Tuesday if Monday's run was spoiled. An oceanographic instrument is a hull with a crew, a fuel bill and a berth list, and the observation it makes is of a fluid that will not be in that configuration again.
The Challenger expedition of 1872 to 1876 established the shape of the problem and has never stopped being the reference case. HMS Challenger left Portsmouth on 21 December 1872 and returned on 24 May 1876, having covered about 68,890 nautical miles. Fifteen of her seventeen guns had been removed to make room for laboratories and a dredging platform, and she carried some 181 miles of Italian hemp rope for sounding. In three and a half years she made 492 deep-sea soundings, 133 bottom dredges, 151 open-water trawls and 263 serial water temperature observations, and brought home about 4,700 marine species previously unknown. On 23 March 1875, between Guam and Palau, her crew recorded a sounding of 4,475 fathoms, and confirmed it with a second cast; the place is now named after the ship.
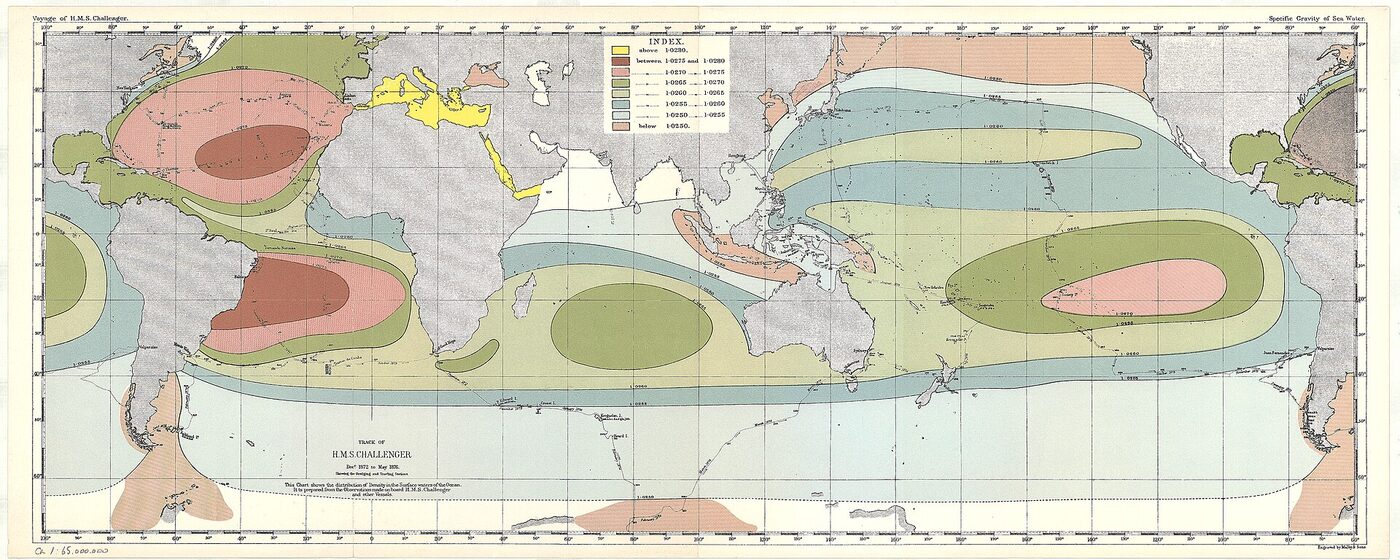

The publication schedule is the part a modern reader should sit with. The report of that voyage ran to 50 volumes and more than 29,500 pages, produced by an office established in Edinburgh for the purpose, and the last of it appeared in 1895 — nineteen years after the ship came home. That is the paper journal system as the proposers of 1994 inherited it, and it is why their charter offered a forum for discussion that would otherwise take months or years, or not happen at all. Their group could not shorten a cruise. It could shorten the wait between the cruise and someone competent hearing about it.
Ship time, and the committee that allocates it
Because a day at sea costs many times a day in a laboratory, and because most of the ships were bought with public money, access to them in the United States is not purchased but allocated. The body that does the allocating is the University-National Oceanographic Laboratory System, and its origin story is a small parable about how scientific infrastructure gets governed.
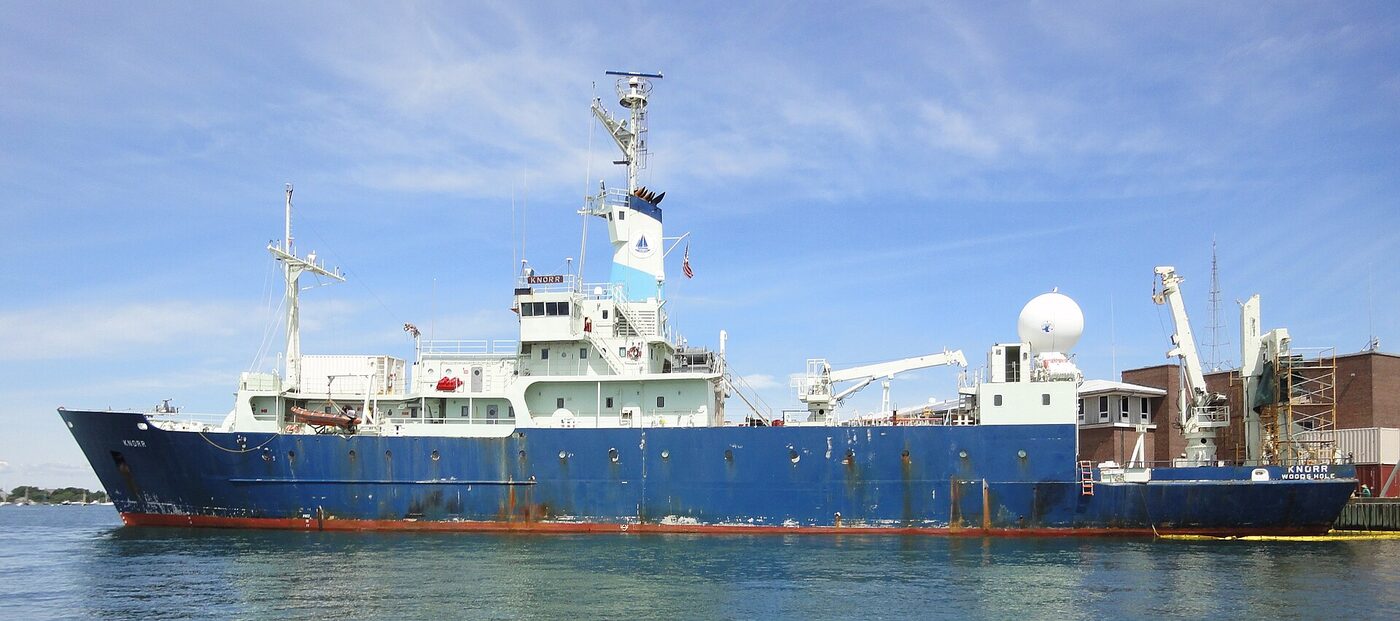
By 1970 the American academic fleet stood at 33 ships operated by 17 laboratories, twelve of them large enough to require regulatory inspection. Three pressures had built up at once: investigators at institutions without ships had no orderly route to sea; the funding agencies, chiefly the National Science Foundation and the Office of Naval Research, were alarmed at the cost of a fleet that was growing while budgets flattened; and the operators could see the collision coming. The President's Commission on Marine Science and Engineering — the Stratton Commission — recommended in 1969 a system of National Oceanographic Laboratories. The academic institutions read that as federal control of their ships and declined it. What emerged instead, from a joint working group of federal and university administrators, was a university-run association that would deliver community-wide access, cooperative scheduling, standardised operations and uniform funding arrangements without putting the fleet under a federal scheduler. UNOLS was chartered in September 1971 at a meeting of seventeen ship-operating laboratories; non-operating laboratories came in first as associates and later as full members, and by December 2009 there were sixty-one member institutions.
.jpg)
UNOLS does not own ships, fund research or operate anything. It runs the scheduling, and it standardises everything around it: cost accounting, cruise reporting, shipboard technical services, safety, foreign research clearances and the mission requirements from which new ships are designed. Its vessels are graded into classes by endurance and science-party size — global, ocean, regional and coastal — with a residual category for ships outside the academic fleet, such as the Coast Guard icebreaker and NOAA's ocean-going research vessel. Its Ship Scheduling Committee has been at work since the 1970s: the earliest entries on its own published meeting list are ship-use forecasting meetings of 1977, a joint east-coast and west-coast scheduling meeting appears in 1988, and the fleet's schedules are archived year by year back to 1991 — which is to say that the entire life of this newsgroup is covered by a public calendar of who was at sea and where.
What that calendar means to an individual is set out in the fleet's own published cruise-planning timeline, which has changed in its details since the 1990s but not in its shape. A ship-time request goes in with the funding proposal, ideally eighteen to twenty-four months before the cruise. Foreign research clearances, where the work is in another country's waters, should be started at least seven months out. The pre-cruise meeting falls six to nine months ahead. Pooled equipment — winches, laboratory vans, towed bodies — is first come, first served, so it is reserved as early as possible. Two weeks before sailing the participant list, the cargo manifest and the berthing plan are finalised. Immediately afterwards a post-cruise assessment form is filed, and the data go to the repository under a management plan written before the proposal was funded.
Two consequences follow, and both of them explain what an unmoderated newsgroup was for. The first is that a working oceanographer's professional life is organised around a schedule fixed years ahead by a committee, in which the important questions — is there a berth, has the instrument been booked, can two groups share a leg — are logistical and time-critical. The second is that this is precisely the class of question that no journal has ever published and no conference is scheduled to answer, and in 1994 the cheapest instrument for asking a thousand colleagues at once had just become a newsgroup.
The institutions that own the ships
The list of organisations able to keep a research vessel at sea is short and old, and the group's constituency largely consisted of their employees. Scripps began in 1903 as the Marine Biological Association of San Diego, founded by the zoologist William Ritter with the newspaper proprietor E. W. Scripps and his half-sister Ellen Browning Scripps, who funded it outright for its first decade and lent it a yacht for its first research vessel; it was incorporated into the University of California in 1912. The Woods Hole Oceanographic Institution exists because a National Academy of Sciences committee concluded in 1927 that it was time to consider the share of the United States in a worldwide programme of oceanographic research, and recommended a permanent independent laboratory on the east coast; a Rockefeller Foundation grant of 2.5 million dollars founded it in 1930 and paid for a building and a 142-foot ketch, Atlantis, whose profile is still the institution's mark. Columbia's Lamont observatory dates from 1948, when Florence Lamont gave her late husband's Hudson River estate to the university; Maurice Ewing directed it from 1949 to 1972, and a Doherty foundation gift added the second half of its name in 1969.
Elsewhere the pattern is national rather than philanthropic. Japan's marine science and technology centre, now JAMSTEC, was founded in October 1971, a month after the American fleet acquired its scheduling association. France's Ifremer was created in 1984. In Britain the work was done under the Natural Environment Research Council, whose Institute of Oceanographic Sciences at Wormley and whose Research Vessel Services at Barry were consolidated into the Southampton building in 1996.
Above the institutions sits intergovernmental machinery, because no state can survey an ocean by itself. The Intergovernmental Oceanographic Commission was established within UNESCO in 1960 and first met at UNESCO headquarters in Paris from 19 to 27 October 1961, with forty founding member states; its membership now stands at 147, and it leads the Global Ocean Observing System. Most of the programmes the group's readers worked on were assembled through structures of that kind, which is why so much of an oceanographer's professional vocabulary consists of acronyms rather than laboratory names.
Bottles, thermometers and the shape of a station
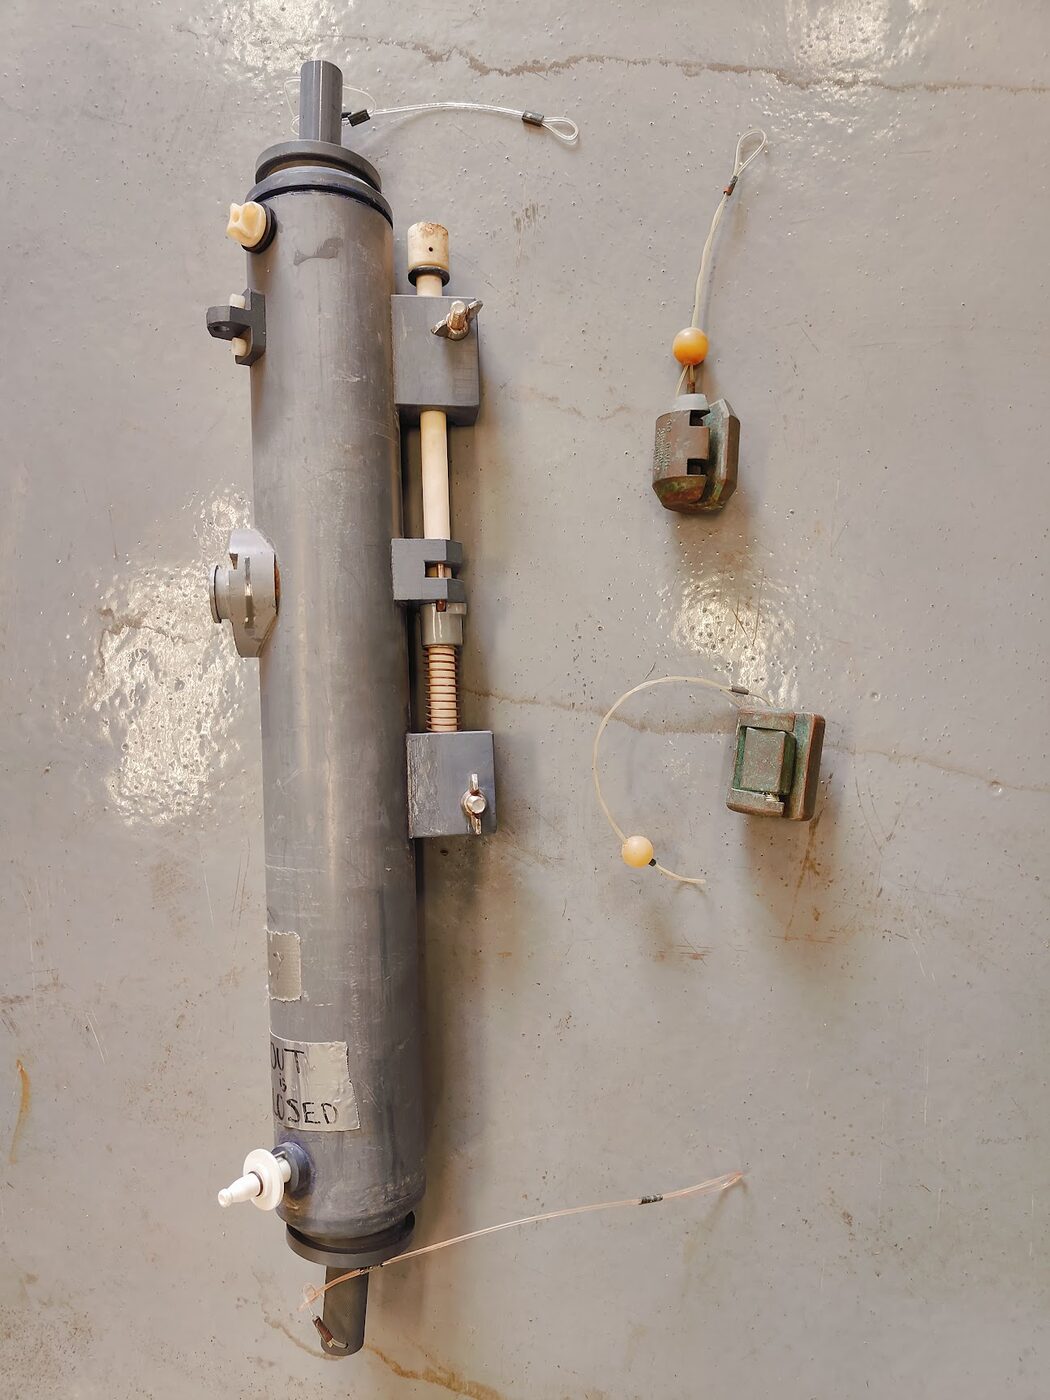
The instruments deserve their own account, because they are what the charter's readers actually argued about and because their documented history is specific enough to be checked. The oldest of them is still in daily use. The Nansen bottle, designed in 1894 by Fridtjof Nansen and originally made of brass, is a tube with a valve at each end, clamped to a weighted cable at intervals. When the cable is at depth and the thermometers have settled, a messenger weight is dropped down the wire; it trips the top of the first bottle, which swings over and closes both valves, trapping its sample, and releases a second messenger to fall to the next bottle, and so on down the cable in a cascade that can be timed to the second.
The temperature was taken by a reversing thermometer clamped to the bottle: a mercury thermometer with a constriction in the capillary, so that inverting it breaks the thread and freezes the reading. Because pressure squeezes the glass and biases the reading, the thermometer is enclosed in a rigid shield, and a second, unprotected thermometer is carried alongside; the difference between the two readings gives the pressure, and therefore the depth, at which the pair reversed. It is an elegant piece of nineteenth-century physics doing a job that a pressure transducer now does silently.
Shale Niskin patented the improvement in March 1966: the metal bottle became an open plastic tube with sprung or elastic-tensioned caps at both ends, which contaminates the sample far less and can be tripped without rotating. Modern versions are triggered electrically from the surface or by a pressure switch, which is what allows as many as thirty-six of them to be mounted in a circular frame — a rosette — and fired individually at chosen depths on the way back up.

The CTD, and the section
The instrument that defined the working day is the CTD, for conductivity, temperature and depth. It was conceived by Neil Brown at the CSIRO Division of Marine Research as an improvement on his own earlier salinity-temperature-depth device, and it exists in the form it does because his management were not interested and he took it to Woods Hole; cheap and reliable computing did the rest. It measures electrical conductivity, temperature and pressure, from which salinity and depth are derived, at a typical scan rate of twenty-four times a second.
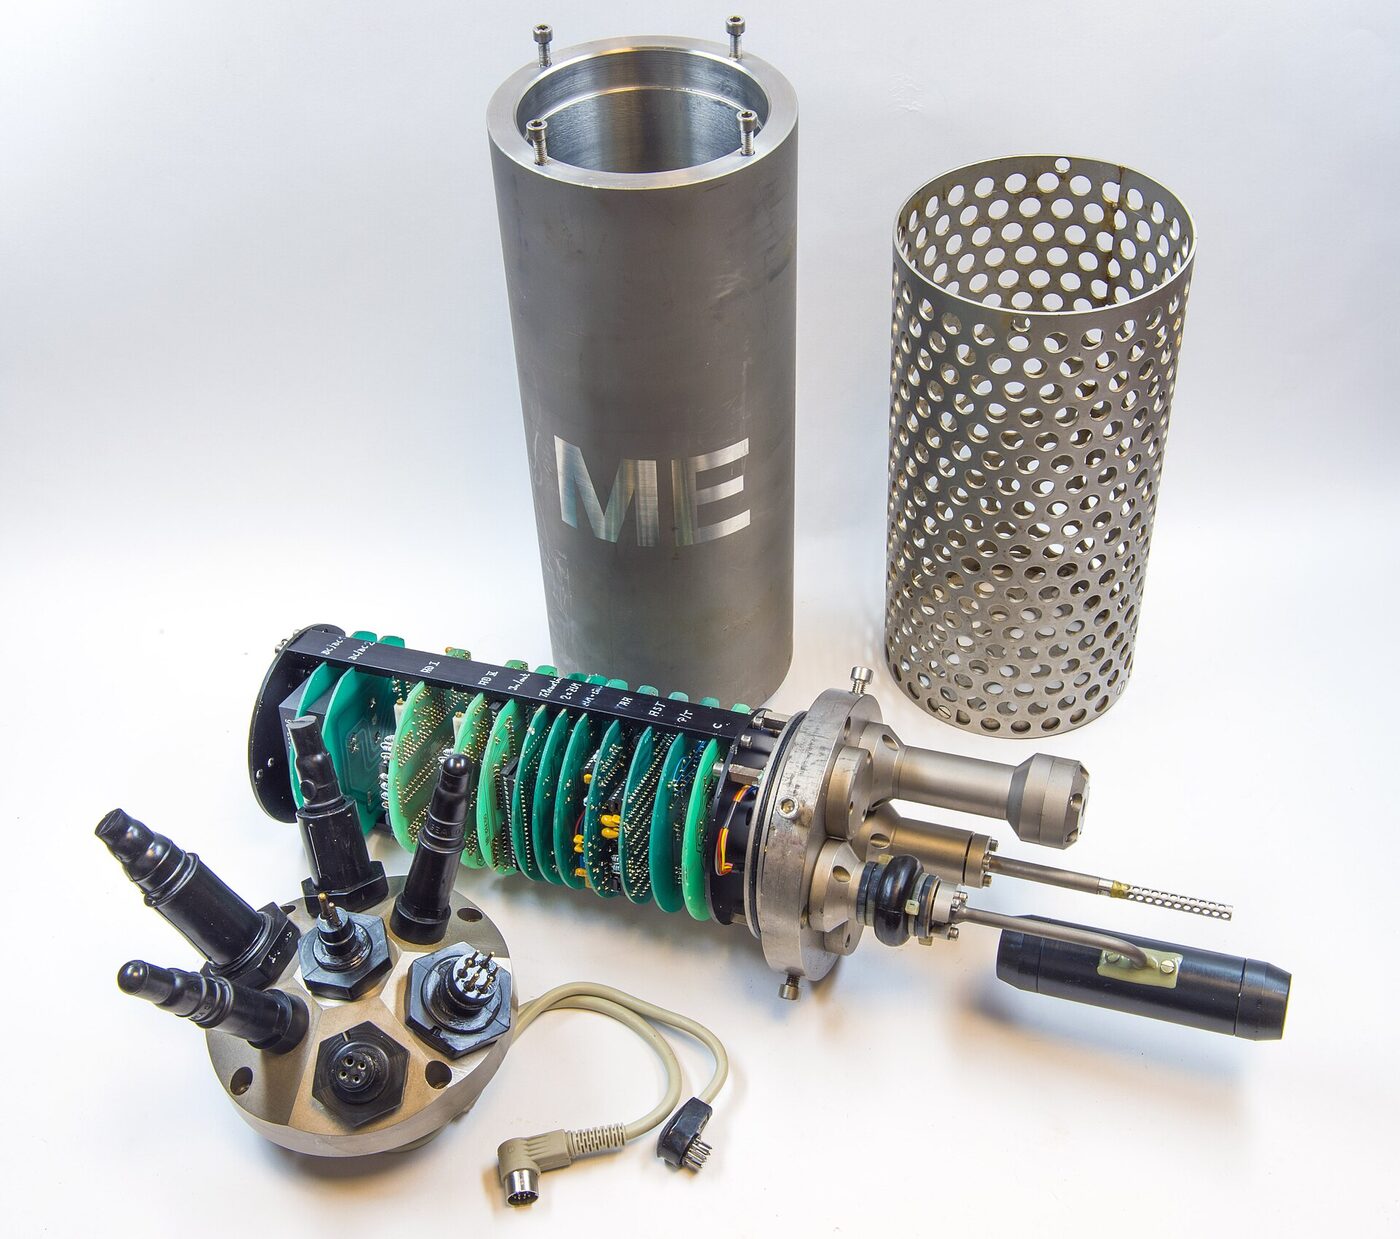

Its first documented deep success came out of the preparations for GEOSECS. On the practice run of Scripps's Antipode expedition in 1971, on leg 15, the Neil Brown CTD was successfully deployed to five thousand metres, and the continuous record it returned produced an immediate discovery: a density discontinuity between Pacific Deep Water and Antarctic Bottom Water. That is the whole case for the instrument in one cast — continuity where there had been points.
In use it is lowered on a conducting cable inside the rosette of Niskin bottles, at about half a metre per second, with the data appearing on a screen on deck as it goes down. The descent is the measurement; the ascent is the sampling, with bottles fired at depths chosen from the profile the downcast has just drawn. Then the ship moves on to the next station and does it again. A hydrographic section — the vertical slice through an ocean basin that appears in the textbooks as a smooth field of colour — is built one station at a time, with the ship stopped for every one, and the limitation is inherent: a cast samples a single point in space and time, and covering a basin means many casts, which means weeks of ship time, which means the schedule described above.
The expendable probe, and the correction that reached backwards
Most of the twentieth century's upper-ocean temperature record was not collected that way, because stopping the ship was unaffordable. The bathythermograph descends from work begun by Carl-Gustaf Rossby in 1935 and completed by his student Athelstan Spilhaus in 1938: a device lowered on a wire that scratched a temperature-against-depth trace on a smoked or coated glass slide. During the Second World War the instrument was fitted to the hulls of American submarines, where a commander could use it to find a thermocline that would distort an attacker's sonar — a rare case of an oceanographic instrument earning its keep by hiding a ship.
Deploying and recovering it in bad weather was dangerous work, done at the rail with the gear already over the side, and that danger is what produced the expendable bathythermograph. James Snodgrass proposed a probe in two parts, its temperature sensed by a thermistor — a shipboard unit and a disposable one — that could be thrown over the side and left behind. An XBT falls freely while paying out a fine wire, so the ship never stops; this is why so much of the record came from merchant vessels on scheduled routes rather than from research ships. It has one weakness, which is that it does not measure depth at all. Depth is inferred from an assumed rate of fall.
In 2007 Viktor Gouretski and Klaus Peter Koltermann published a comparison of XBT temperatures against CTD measurements, under the title How much is the ocean really warming?, and demonstrated a systematic bias between them that also varied over time. Because a temperature-against-depth profile is integrated to estimate ocean heat content, an error in the fall-rate equation propagates directly into the heat-content record, and corrections — to the depth calculation and to the reported temperature alike — had to be worked out and applied backwards across decades of archived casts, a problem that took international workshops in 2008 and again in 2010 to make progress on. The episode is worth recording precisely because it is unglamorous: an argument about a global quantity turned on a coefficient in an equation describing how fast a piece of expendable plastic sinks, and the only reason it could be settled at all was that the original casts had been kept in a form that allowed them to be re-examined.
Instruments left behind
What changed the arithmetic of ship time was the practice of leaving instruments in the water. A mooring — an anchored line carrying sensors at fixed depths, recording for a year at a time — converts one visit into a year of measurements, at the price that if it is lost, the year is lost with it.
The largest of the moored arrays was built across the tropical Pacific in direct response to the 1982–83 El Niño, which the observing system of the day had substantially failed to see coming. Development of the Tropical Atmosphere Ocean array began in 1985 and, in the phrase used by the laboratory that ran it, it was built over the ten-year period 1985 to 1994; the full array of about seventy deep-ocean moorings was completed in 1994. Each surface buoy reports by satellite in near real time, measuring winds, air temperature, humidity and sea-surface temperature above the water and subsurface temperature at ten depths through the upper 500 metres, with current-measuring moorings on the equatorial line; the moorings are recovered and replaced on an annual cycle by a dedicated ship. In January 2000 the array was renamed TAO/TRITON, in recognition of the Japanese moorings that had extended it into the western Pacific.
It was largely through that array, and through the satellite altimeter described below, that the El Niño of 1997–98 — among the strongest on record, developing from May 1997 and gone by June 1998 — was watched as it happened rather than reconstructed afterwards. For a discipline accustomed to learning what the ocean had done from data recovered months later, this was new.
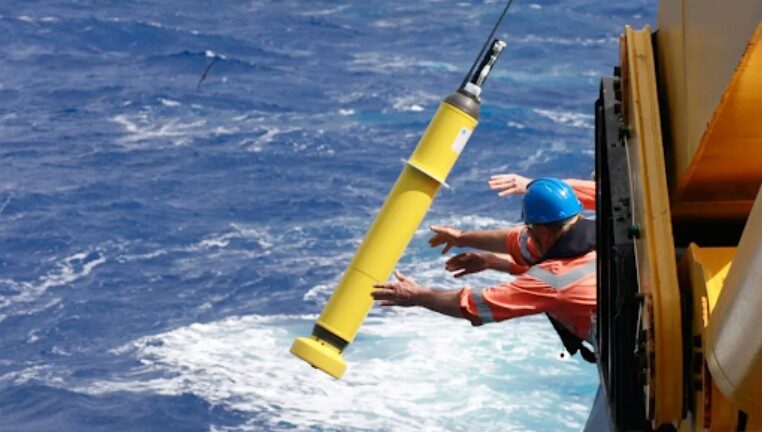
The Global Drifter Program took the opposite approach and let the instrument go. Conceived by Peter Niiler, it originated in February 1979 within the equatorial Pacific circulation programme, and the first large-scale deployment came in 1988. Each drifter is a surface float tethered to a weighted drogue at fifteen metres, so that it follows the water rather than the wind; the standing target is 1,250 of them worldwide. The design's known failure mode is the loss of the drogue, after which the wind pushes the bare float and the observation silently becomes wrong — which is why a strain gauge on the tether was added to report whether the drogue is still there. Instrumental honesty of that kind is a recurring theme in this field, and much of it was worked out in public.
Argo completed the change. Proposed at the OceanObs conference in 1999, with a prospectus drawn up by a small group of scientists chaired by Dean Roemmich, it called for a global array of about 3,000 profiling floats to be in place by 2007, and the first of them went into the water in 2000. A float parks at about a thousand metres, descends to two thousand every tenth day, profiles temperature and salinity on the way up and reports by satellite from the surface before sinking again; its drift while parked measures the current at depth. The 3,000-float array was achieved and global in November 2007, and the target was later raised to 4,000 to cover boundary currents, marginal seas and the equator.
One statistic from that programme states the ship-time problem more sharply than any argument could. In November 2012 a float in the Argo array returned the programme's one-millionth profile — twice the number collected by research vessels in the whole of the twentieth century. A further consequence, easily missed, is that the floats do not care what month it is: south of thirty degrees south, the historical record was collected roughly four times as often in the austral summer as in the winter, for the obvious reason, and the float record shows no such seasonal bias at all.

The view from orbit
The other transformation of the group's decade came from above. TOPEX/Poseidon, a joint mission of NASA and the French space agency CNES, was launched on 10 August 1992 on an Ariane 42P from Kourou. From an orbit 1,330 kilometres up its radar altimeter measured the height of the sea surface over 95 per cent of the ice-free ocean to an accuracy of about 3.3 centimetres. Earlier altimeters had glimpsed that surface; this was the first continuous global record of it, and because the slope of the sea surface is a measure of the currents beneath it, the mission produced the first global views of seasonal changes in the currents and the first global map of the tides.
It was planned for three years and returned more than ten. A momentum wheel failed in October 2005, after more than 62,000 orbits, and the satellite was turned off on 18 January 2006; Jason-1, launched in 2001, had already flown alongside it for three years to hand the record on. Walter Munk, who had spent a career trying to measure the ocean from a ship, called it the most successful ocean experiment of all time.
What the altimeter could not do is the point that kept the ships busy. It measures a surface. The heat, the salt and the carbon are in the interior, and until the floats arrived nothing but a hull with a winch could reach them.
The programmes the decade was made of
The acronyms that fill this field's conversation are all the same kind of object: a multi-national, multi-year, committee-planned campaign of cruises, whose participants spent years working towards a berth and years afterwards working up the data.
The Geochemical Ocean Sections Study began as an idea of Henry Stommel's in 1967, that geochemical tracers could be used to trace mixing and circulation. He met Wallace Broecker, Harmon Craig and Karl Turekian the following year to plan a programme, and the panel that formed around them grew over the year after that; methods were developed on preliminary cruises from 1969 to 1972; and the expeditions themselves ran in the Atlantic from July 1972 to May 1973, in the Pacific from August 1973 to June 1974, and in the Indian Ocean from December 1977 to March 1978. Five years from the idea to the first expedition, and nearly six more before the last leg came home, for one three-dimensional map of the ocean's tracers.
The Joint Global Ocean Flux Study, initiated by the Scientific Committee on Oceanic Research, ran from 1987 to 2003 on the fluxes of carbon between air and sea and within the ocean interior. Two of its early decisions outlived it: the time-series stations established in 1988 near Bermuda and off Hawaii are still making the same measurements at the same places, which is the only way a slow trend can ever be separated from a busy season.
The World Ocean Circulation Experiment was the largest of them: a component of the World Climate Research Programme whose field phase ran from 1990 to 1998, followed by an analysis and modelling phase to 2002. Its purpose was to survey the whole ocean once, properly, with instruments and coverage designed from the outset for comparison against models rather than inherited from surveys done for other reasons — the southern hemisphere and the winter months being the acknowledged holes in everything that existed before, along with doubts about the accuracy of some of what did exist. It was built around the altimeters then in orbit, high-quality hydrography, geochemical tracers, surface flux measurements and observations from voluntary observing ships. Its sections are still being reoccupied, so that change can be measured against the 1990s baseline, under the international GO-SHIP repeat-hydrography programme.
Scientific ocean drilling is ship time in its most rationed form. The Deep Sea Drilling Project ran from 1968 to 1983 under a contract signed in June 1966 between the National Science Foundation and the University of California, with Scripps as operator and the Glomar Challenger as the ship; seventeen holes at ten sites along the ridge between South America and Africa produced the core evidence for sea-floor spreading, and from 1975 the project was internationalised. The Ocean Drilling Program followed from 1985 to 2003 with the JOIDES Resolution, and the successor programmes ran from 2003 until the last expedition ended in September 2024. Throughout, expeditions were selected from proposals judged by international advisory panels on science, feasibility, safety and environmental grounds, which is to say that a scientist's chance of sampling a particular piece of sea floor was decided by a committee, years in advance, and once.
A deep sea that had recently surprised everybody
Anyone entering the subject in the 1990s had inherited a field that was younger than it looked. In February 1977 dives by the submersible Alvin on the Galápagos Rift, on an expedition whose principal investigator was Jack Corliss of Oregon State University, found warm water venting from the sea floor at around twenty degrees and a dense animal community clustered around it; the results were published in Science in 1979. On the RISE expedition to the crest of the East Pacific Rise at 21 degrees north, in April 1979, Alvin found high-temperature vents discharging at around 380 degrees and precipitating the mineral chimneys that were promptly named black smokers.
The animals at a hydrothermal vent do not live on sunlight. The base of the food chain is chemosynthetic bacteria and archaea drawing energy from sulphur compounds that are lethal to most life, in symbiosis with the tube worms, clams and limpets that appear to be feeding on nothing. An entire productive ecosystem, of a type nobody had predicted, had been sitting on the mid-ocean ridges throughout the period in which the textbooks were written. It is worth stating plainly, because it conditions everything a newsgroup of oceanographers would have taken for granted: within the working lifetime of most of its readers, the deep sea had comprehensively surprised the people who studied it, and the reasonable inference was that it would do so again.
Archives, and a discipline required to deposit
Oceanography arrived early at the practice of depositing data rather than keeping it. The United States National Oceanographic Data Center was established in 1961 as an interagency facility under the Navy's Hydrographic Office, was transferred to NOAA on that agency's creation in 1970, and was merged in 2015 with the climatic and geophysical data centres into the National Centers for Environmental Information. Alongside it at Silver Spring sat one of the three World Data Centers for Oceanography — the others are in Moscow and Tianjin — part of a system set up in 1957 for the International Geophysical Year. In the same year that the American centre was founded, the Intergovernmental Oceanographic Commission created the International Oceanographic Data and Information Exchange to move data between member states and their national centres.
Britain's equivalent has a lineage worth setting out because it shows the same forces at work. The Natural Environment Research Council created the British Oceanographic Data Service in 1969 at the National Institute of Oceanography at Wormley, explicitly to act as the national data centre and to take part in the commission's international exchange. It moved to Bidston Observatory on the Wirral in 1975, became the Marine Information and Advisory Service the following year, handling data from weather ships, oil rigs and data buoys, was restructured as the British Oceanographic Data Centre in April 1989, and moved to a purpose-built building on the University of Liverpool campus in December 2004. Some of its holdings are older than any of those names: the Permanent Service for Mean Sea Level, which keeps the world's tide-gauge records and is now at the same Liverpool site, began in 1933 as a committee of the International Union of Geodesy and Geophysics and became a permanent service of the International Council for Science in 1958.
The archive that pulls the rest together is the World Ocean Database, first released in 1994 — the year of the vote — and reissued at intervals since, with releases in 1998, 2001, 2005 and 2009. The 2009 edition held more than nine million temperature profiles and 3.6 million salinity profiles. The current edition, released in 2023, holds more than 18.6 million oceanographic casts made up of 3.13 billion individual measurements, drawn from sixty-five national oceanographic data centres and nine designated national agencies, from the great international programmes — the circulation experiment and the flux study among them — from real-time observing systems, and from data archaeology and rescue projects that go looking for observations sitting in filing cabinets. Its earliest data come from Captain Cook's voyage of 1772. It is organised by instrument type, and the list of types is a fair history of the subject in itself: ocean station data, mechanical and expendable bathythermographs, CTDs, undulating recorders, profiling floats, moored and drifting buoys, gliders, and the autonomous pinniped bathythermograph — that is, the seal with a sensor glued to its head, which goes where no ship can be scheduled.
What makes this a genuine contrast with most of sci.* is that depositing is not a courtesy. The funding agency's own policy for ocean sciences requires metadata, full data sets, derived products and physical collections to be made publicly accessible within two years of collection, with any longer moratorium requiring compelling justification documented in the data management plan of the proposal itself. Underway sensor data from the American academic fleet — navigation, meteorology, thermosalinograph, echo sounder, all the streams a ship generates simply by moving — are routinely gathered ashore into a shore-side repository, to the point that the fleet's published cruise-planning timeline treats it as one more item a chief scientist ticks off. Argo went further still and made its profiles free to everyone without restriction, reaching every member state of the meteorological organisation within hours of a float surfacing over that organisation's own telecommunications system, and mirrored at two global data centres, one in France and one in the United States. A field whose members had spent careers negotiating access to other people's cruise data had, within a decade, made unrestricted immediate release the default.
What the archives were for
Those holdings are the reason the ocean became central to the climate argument, and the case was a measurement case first. The tide-gauge network, extended by satellite altimetry after 1992, established that global mean sea level rose about 19.5 centimetres between 1870 and 2004, an average of roughly 1.44 millimetres a year. The altimeter series begun by TOPEX/Poseidon records about 7.5 centimetres over the altimetry era from 1993, an average of roughly 2.9 millimetres a year, with a measurable acceleration within it. The larger quantity is heat: between 1971 and 2018 the ocean absorbed more than ninety per cent of the excess energy accumulating in the Earth system, which is why the ocean, rather than the atmosphere, is where the arithmetic of the energy balance is done.
Every one of those numbers exists because somebody kept the casts, the gauge sheets, the mooring records and the float profiles in a form that could be read decades later, and because the corrections described earlier could be applied to them retrospectively. The archive is not a by-product of the science; in this field it is the instrument of record.
What the group carried, as classes of traffic
No archive of this group's own postings is presented here, and no thread, poster, quotation or message count from it is asserted anywhere on this page. What can be described honestly is the classes of traffic a group with this charter, this constituency and this discipline would have carried, each of which is supported either by the charter's own list of topics or by the documented working practice of the field.
- Instruments and calibration. The charter names ocean instruments, and hardware and equipment with specifications and opinions, as separate items. This is a field in which the difference between two thermometers, or a drift in a conductivity cell, is the difference between a result and an artefact, and in which the manufacturers of the standard sensors are few enough to be named in a sentence. It is also the traffic of the instrument engineers and shipboard technicians who are all but invisible in the published literature and without whom none of the rest of it exists.
- Data formats, software and databases. Three consecutive lines of the charter. The practical questions of the decade were how to read one archive's format in another's software, and how to get an instrument's output into the shape a data centre would accept.
- Cruise announcements, conferences and berths. The charter's last topic before its catch-all is Positions vacant. Ship-time allocation produces a standing, time-critical demand for people: berths open when a schedule shifts, and a cruise that has lost a technician needs one within weeks. The fleet still runs notices of this kind — open calls to apply to sail on particular cruises, and a volunteer programme for people who want sea time — and in the 1990s a newsgroup was the fastest way to broadcast one.
- Graduate-student traffic. Every discipline group carried it: what to read, which method to use, which laboratory to apply to, and whether a result that looks wrong is wrong. In a field where the apprenticeship includes weeks at sea with strangers, the questions have a practical edge that the literature does not answer.
- Observations from people who were already at sea. Sailors, divers, fishers and merchant crews see the ocean far more often than oceanographers can afford to, and an unusual current, temperature or animal reported by one of them is the kind of thing a professional values and cannot schedule. The broader argument about non-professionals with instruments belongs to the branch page and is not rehearsed here.
These are kinds, not counts. The distinction matters on a page that universities cite.
The arguments of the decade
Certain subjects recurred in the field throughout the group's life, and a page about the group is obliged to describe them without taking sides in any of them. The first was the thermohaline circulation — the density-driven overturning that forms deep water in the North Atlantic and around Antarctica and returns it on a timescale of order a thousand years — and the question of how stable it is, what might slow it, and how much of the popular conveyor-belt cartoon survived contact with the observations. The second was mixing: the small-scale turbulence that stirs the abyss and sets the rate of nearly everything else, notoriously hard to measure and harder to parameterise. The third was heat uptake, and the confidence that could be placed in a record assembled from instruments never designed to be compared with one another. The fourth was the ocean's role as a carbon sink, pursued through the flux study described above.
Three public arguments touched the field from outside, and the neutral historian's job here is to record that they happened and what shape they had. The first was acoustic thermometry. Walter Munk and Carl Wunsch had proposed in the early 1980s that ocean temperature could be measured over whole basins by timing low-frequency sound between fixed points, since the travel time of sound is a direct measure of the temperature averaged along its path; the Heard Island Feasibility Test of January 1991 showed that the signals crossed ocean basins, and did so before the experiment had formally begun, when a night of low-power equipment checks was heard on both American coasts. The Acoustic Thermometry of Ocean Climate programme that followed transmitted in the North Pacific from 1996 until the autumn of 2006, when the agreed environmental protocols expired; its source sat on the sea floor north of Kauai. It was opposed on the grounds that the transmissions might harm whales and other marine mammals, and the dispute was genuinely difficult because it required simultaneous judgements in physical oceanography, underwater acoustics and marine mammal biology, in a field where much was not known — and because some of the early public argument turned on confusions as basic as the difference between a decibel measured in air and a decibel measured in water. A marine mammal research programme costing some six million dollars ran alongside the transmissions; its formal conclusion after six years of study was that they had no biologically significant effects.
The second was fisheries. Canada's moratorium on the northern cod in 1992 was the largest industrial closure in the country's history; approximately 37,000 fishermen and plant workers lost their jobs, and the argument about cause — trawler technology and fishing effort above all, and how much the physical environment contributed — ran well beyond stock-assessment meetings and into national politics. Fishing off Newfoundland and Labrador reopened commercially only in 2024. The third was climate attribution, sharpened after the Intergovernmental Panel on Climate Change concluded in 1995 that the balance of evidence suggested a discernible human influence on global climate — a form of words argued over at the panel's own plenary before it was adopted. Oceanographers had particular standing in that argument for the reason set out above: the ocean holds the heat, and therefore holds the memory of the system.
This page documents that these arguments existed and describes their shape. It does not adjudicate them, and the register is deliberate.
Where it went
Scientific conversation of this kind moved off Usenet during the 2000s, and where it went is better documented than why any particular group fell quiet. Three destinations account for most of it.
The first is the data portal. The functions a newsgroup had served for finding and swapping data were absorbed by systems that did it properly: the two Argo global data centres, the reorganised American environmental data centre from 2015, the national centre at Liverpool, the hydrographic data offices holding the survey programmes' sections, and the shore-side archive of the fleet's underway data. When the answer to does anyone have salinity for this box became a query form, the question stopped being posted.
The second is the programme mailing list and its associated apparatus. Every one of the campaigns described above ran its own announcement lists, project offices and periodic meetings; the community's decadal set-piece conference, at which Argo was proposed in 1999 and reviewed in 2009, is the visible peak of a great deal of routine circulation. A mailing list run by a project office reaches exactly the people concerned and no others, which is an advantage over a public group and also, in the long run, a loss.
The third is the general drift of informal traffic off Usenet altogether — the cruise photograph, the request for an observation from somebody who happens to be at sea — first to the web and eventually to social media. The gateway whose snapshot this directory preserves carried the group to e-mail between 2000 and 2004, near the end of the period in which a field of this kind still talked to itself in public. The name itself has never gone away: it survived the forged removals of 2001, and it is still in the master files today, still flagged for posting.
What the record does not show
It is worth being explicit about the size of the hole. The surviving paperwork for this group is complete and unusually good: a request for discussion, two calls for votes, a result with the full voter list, four newgroup control messages and one forged removal. What it does not contain is the group itself.
Nothing in the archives consulted for this page establishes how many people read the group, how many posted, what the annual traffic was, whether a FAQ was ever written and maintained, whether anyone acted as an informal moderator of tone, or when the group's traffic thinned. There is no record of a rename or a split, although the proposers explicitly left the door open to one; no record of a moderation proposal; and, after the routine creation messages of 1994 and 1995, no administrative activity at all until the forged removals of 2001. Every one of those is a real gap and not a stylistic omission: the numbers do not exist in the sources available here, and this page does not supply them.
Scope and limits of this page
Everything asserted above about the group's own history — the proposers, the dates, the cross-post list, the charter, the tallies, the newsgroups line, the control messages — is taken from the Usenet administrative archive mirrored by the Internet Systems Consortium, and the counts of voters by domain were made by tabulating the published voter list. Those counts are of ballots, not of people or of readers, and mapping an e-mail domain to an institution is approximate: a laboratory may appear under several machine names, and a person may vote from an address that says nothing about where they work.
Everything asserted about instruments, programmes, institutions and archives is drawn from published reference sources, from the documentation of the programmes themselves and from the fleet's and the funding agency's own published policies, and dates and figures have been checked against them rather than recalled. Where a source gives only a year, only a year is given here. Where a figure has been revised by its source since this page was first written, the current figure is used. Where the record is silent, this page says so.
Finally, a note on what this page is not. It is not a history of oceanography, which is much larger, and it is not an account of the sci.geo.* namespace or of the sci.* hierarchy, which are told on sci.geo and sci.* respectively. Readers interested in how a comparable science manages a scarce, committee-allocated instrument may find the parallel drawn on sci.space.station instructive: the constraint there is orbital, the paperwork is different, and the effect on the working life of a scientist is remarkably similar.
Reading sci.geo.oceanography today
- Historical archive: Google Groups — sci.geo.oceanography (coverage varies by group and era).
- Open in a newsreader:
news:sci.geo.oceanography— the original site offered exactly this link, and it still works if your system has a newsreader registered for thenews:scheme. - Live access: point an NNTP newsreader at a modern server — see accessing Usenet today.
- The original news2mail e-mail subscription service ended in the mid-2000s and no longer operates.